Overview
The current methods of getting statistics out of the network equipment is to use SNMP. This can provide lots of in depth statistics about the health and status of the network. While this has worked fine for many years, it has its limitations. All statistics need to be collected and provided by the routing engine. As the number of metrics you with to measure increases, this places an increased burden on the control plane. Due to this, there is a limitation on the granularity of the statistics that can be collected.
Streaming telemetry overcomes this by operating a subscription model. The metrics that an operator are interested in are set up in advance, and then the devices send their metrics to the collector in regular intervals without any further requests. This alternative method of data generation allows a lot of the processing to be pushed down to the line cards. This reduces load on the control plane while allowing more fine grained statistics to be gathered.
In this blog post I’m going to walk through setting up Telegraf to ingest telemetry data, Influx to store the data, and Grafana to display the data. The devices I’m going to be streaming the data from is a Cisco CSR1000V a Cisco XRv, and a Juniper vMX. The host OS for my collector is Ubuntu 18.04.03.
InfluxDB & Telegraf
The installation for Influx is pretty straight forward, and taken direct from their documentation pages.
# Trust the Influx GPG key
wget -qO- https://repos.influxdata.com/influxdb.key | sudo apt-key add -
# Add the Influx repositories to apt
source /etc/lsb-release
echo "deb https://repos.influxdata.com/${DISTRIB_ID,,} ${DISTRIB_CODENAME} stable" | sudo tee /etc/apt/sources.list.d/influxdb.list

# Update the repositories, and install influx
sudo apt-get update && sudo apt-get install influxdb

# Enable influx, and start it
sudo systemctl unmask influxdb.service
sudo systemctl start influxdb
Once these commands have finished running, you should be able to log into the Influx CLI to verify that it is working.
dave@linux:~$ influx
Connected to http://localhost:8086 version 1.7.9
InfluxDB shell version: 1.7.9
> quit
dave@linux:~$
Telegraf
Installing telegraf is a little more involved, as it requires creating a configuration file. We will use the tool itself to generate a template for the service for Cisco devices (as its simplest!)
# Update the repositories, and install telegraf
sudo apt-get update && sudo apt-get install telegraf

# Generate the telegraf configuration with input from Cisco
# devices, and output to Influxdb
sudo telegraf --output-filter influxdb --input-filter cisco_telemetry_mdt config | sudo tee /etc/telegraf/telegraf.conf

# Enable and start the service
sudo systemctl enable telegraf
sudo systemctl start telegraf
Telegraf should now start, create a database in influx and begin listening on port 57000 for Cisco telemetry traffic. We can test that this is the case.
dave@linux:/etc/systemd$ sudo ss -plant
State  Recv-Q  Send-Q        Local Address:Port            Peer Address:Port
LISTEN 0       128           127.0.0.53%lo:53                   0.0.0.0:*       users:(("systemd-resolve",pid=737,fd=13))
LISTEN 0       128                 0.0.0.0:22                   0.0.0.0:*       users:(("sshd",pid=983,fd=3))
LISTEN 0       128               127.0.0.1:8088                 0.0.0.0:*       users:(("influxd",pid=2348,fd=3))
ESTAB  0       0              82.71.240.83:22              212.23.9.213:63810   users:(("sshd",pid=1304,fd=3),("sshd",pid=1166,fd=3))
LISTEN 0       128                       *:8086                       *:*       users:(("influxd",pid=2348,fd=5))
LISTEN 0       128                    [::]:22                      [::]:*       users:(("sshd",pid=983,fd=4))
LISTEN 0       128                       *:3000                       *:*       users:(("grafana-server",pid=3861,fd=6))
LISTEN 0       128                       *:57000                      *:*       users:(("telegraf",pid=4794,fd=6))
ESTAB  0       0                     [::1]:36856                  [::1]:8086    users:(("telegraf",pid=4794,fd=5))
ESTAB  0       0                     [::1]:8086                   [::1]:36856   users:(("influxd",pid=2348,fd=6))
ESTAB  0       0         [::ffff:10.0.2.1]:57000   [::ffff:192.168.0.2]:60761   users:(("telegraf",pid=4794,fd=7))

dave@linux:/etc/systemd$ influx
Connected to http://localhost:8086 version 1.7.9
InfluxDB shell version: 1.7.9
> show databases
name: databases
name
----
_internal
telegraf
> exit
Grafana
The Grafana installation is also equally straight forward, and well documented on their website.
sudo add-apt-repository "deb https://packages.grafana.com/oss/deb stable main"
wget -q -O - https://packages.grafana.com/gpg.key | sudo apt-key add -
sudo apt-get update
sudo apt-get install grafana

sudo systemctl daemon-reload
sudo systemctl start grafana-server
At this point we are able to log into the web ui located at http://<server-ip>:3000/ with the credentials admin/admin. We can then navigate to add a new datasource, choose influx, then fill in a few details. The important ones are:
- URL: http://localhost:8086
- Database: telegraf
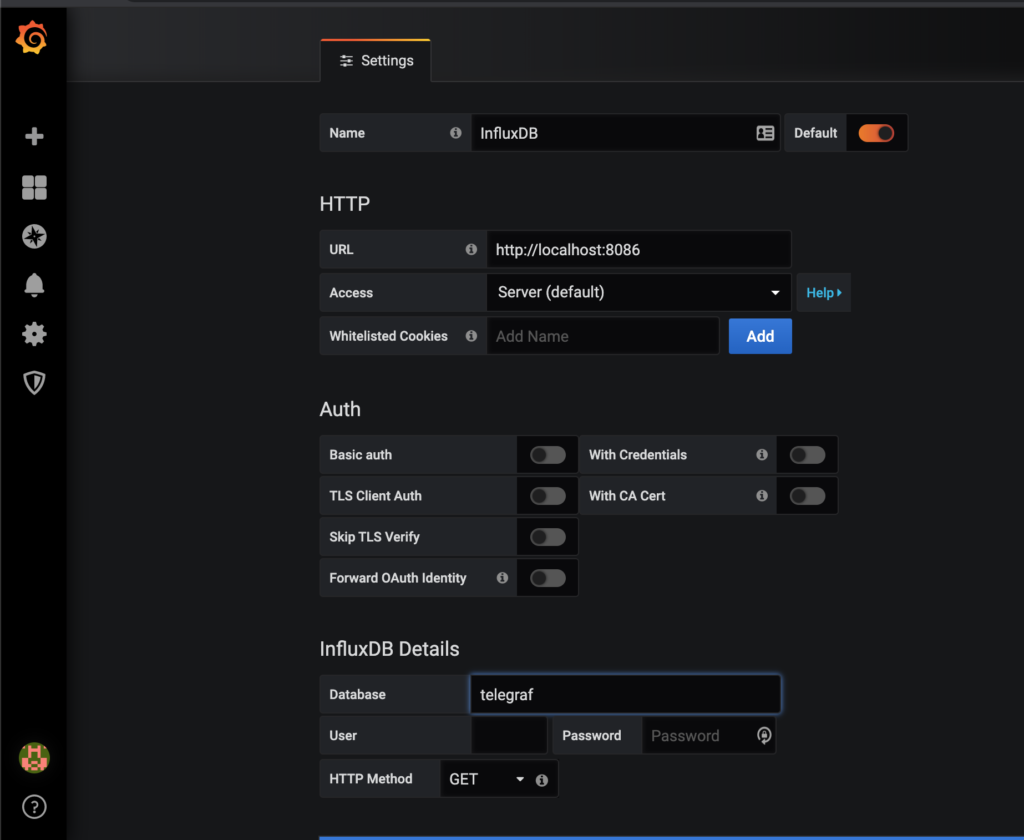
Once these details are filled in, chose save and test at the bottom of the page, and it should indicate that everything is working correctly.
YANG Xpath
Vendors publish YANG models that define what data they are able to export (These models are also used for defining the structure for configuration). The data is represented as a tree structure, with individual elements selected using XPath.
Working with the YANG files can be a bit difficult, as there don’t exist any user friendly tools for manipulating them yet. I’ve had some success with pyang and Yang Explorer. Juniper also have their Telemetry Sensor Explorer which contains the full trees for all their devices.
The YANG files can be typically downloaded from the vendors website, or the device in question itself. Alternatively, there is this git repository, which holds IETF models, as well as as some of the more popular vendors models.
Cisco IOS XE
Telemetry is supported on IOS XE on versions above 16.6. I am running Cisco IOS XE Software, Version 16.12.02 (Gibraltar).
The first thing that is required is to enable netconf-yang. Following that each metric can be enabled by using the following config.
telemetry ietf subscription <UNIQUE ID FOR METRIC>
 encoding encode-kvgpb
 filter xpath <XPATH>
 source-address <SOURCE IP>
 stream yang-push
 update-policy periodic <UPDATE PERIOD IN 10'S OF MS>
 receiver ip address <IP ADDRESS OF COLLECTOR> 57000 protocol grpc-tcp
Example Cisco IOS XE Configuration
netconf-yang

telemetry ietf subscription 1
 encoding encode-kvgpb
 filter xpath /process-cpu-ios-xe-oper:cpu-usage/cpu-utilization/five-seconds
 source-address 192.168.0.2
 stream yang-push
 update-policy periodic 5000
 receiver ip address 10.0.2.1 57000 protocol grpc-tcp

telemetry ietf subscription 2
 encoding encode-kvgpb
 filter xpath /process-cpu-ios-xe-oper:cpu-usage/cpu-utilization/one-minute
 source-address 192.168.0.2
 stream yang-push
 update-policy periodic 5000
 receiver ip address 10.0.2.1 57000 protocol grpc-tcp

telemetry ietf subscription 3
 encoding encode-kvgpb
 filter xpath /process-cpu-ios-xe-oper:cpu-usage/cpu-utilization/five-minutes
 source-address 192.168.0.2
 stream yang-push
 update-policy periodic 5000
 receiver ip address 10.0.2.1 57000 protocol grpc-tcp

telemetry ietf subscription 4
 encoding encode-kvgpb
 filter xpath /memory-ios-xe-oper:memory-statistics/memory-statistic/used-memory
 source-address 192.168.0.2
 stream yang-push
 update-policy periodic 5000
 receiver ip address 10.0.2.1 57000 protocol grpc-tcp

telemetry ietf subscription 5
 encoding encode-kvgpb
 filter xpath /memory-ios-xe-oper:memory-statistics/memory-statistic/free-memory
 source-address 192.168.0.2
 stream yang-push
 update-policy periodic 5000
 receiver ip address 10.0.2.1 57000 protocol grpc-tcp

 telemetry ietf subscription 6
 encoding encode-kvgpb
 filter xpath /interfaces-ios-xe-oper:interfaces/interface/statistics
 source-address 192.168.0.2
 stream yang-push
 update-policy periodic 5000
 receiver ip address 10.0.2.1 57000 protocol grpc-tcp
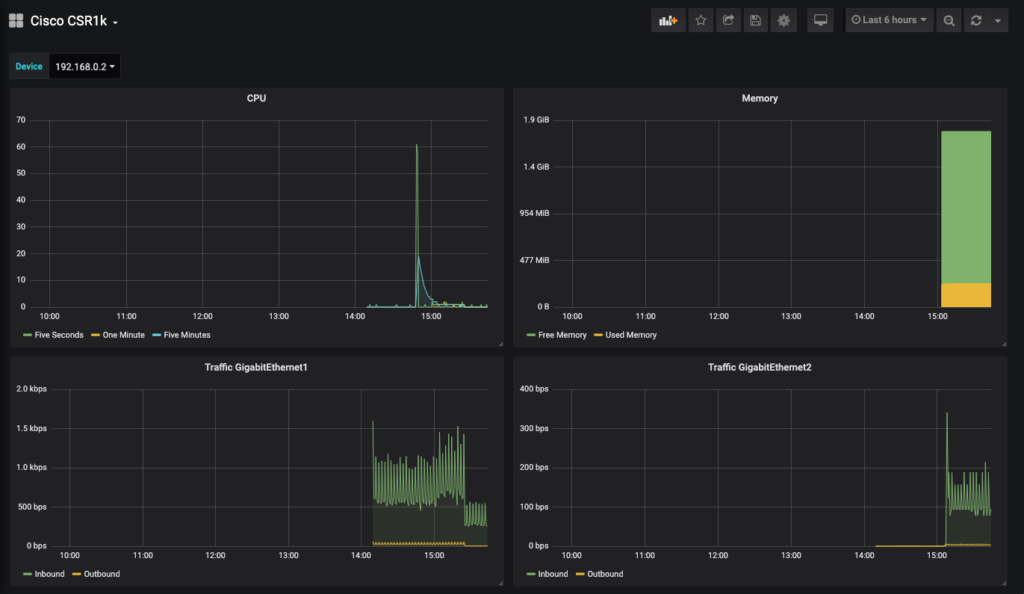
At this point, we now have a Cisco IOS XE router generating statistics, and sending them to Telegraf. We can check on the router to ensure that it is connected to the collector with show telemetry ietf subscription 1 receiver
CSR1K#show telemetry ietf subscription 1 receiver
Telemetry subscription receivers detail:

  Subscription ID: 1
  Address: 10.0.2.1
  Port: 57000
  Protocol: grpc-tcp
  Profile:
  State: Connected
  Explanation:
At this point we are free to create graphs in Grafana to display our metrics. There is a lot of information out on the web on how to do this, so I won’t be covering that there.
Cisco IOS XR
Telemetry support was added to Cisco IOS XR in versions 6.1.2. I’m running Cisco IOS XR Software, Version 6.5.1.
IOS XR can use the same method of streaming telemetry data to Telegraf as IOS XE, which means that no changes to the collection server are required. The only thing we need to do is to add some configuration to the device we wish to monitor.
telemetry model-driven
 destination-group <NAME FOR SERVER GROUP>
  address-family ipv4 <SERVER-IP> port 57000
   encoding self-describing-gpb
   protocol grpc no-tls

 sensor-group <NAME FOR SENSOR GROUP>
  sensor-path <SENSOR>

 subscription sub
  sensor-group-id <NAME FOR SENSOR GROUP> sample-interval <UPDATE PERIOD IN MILLISECONDS>
  destination-id <NAME FOR SERVER GROUP>
Example IOS XR Config
telemetry model-driven
 destination-group DGROUP
  address-family ipv4 10.0.2.1 port 57000
   encoding self-describing-gpb
   protocol grpc no-tls
  !
 !
 sensor-group SGROUP
  sensor-path Cisco-IOS-XR-wdsysmon-fd-oper:system-monitoring/cpu-utilization
  sensor-path Cisco-IOS-XR-nto-misc-oper:memory-summary/nodes/node/summary
  sensor-path Cisco-IOS-XR-infra-statsd-oper:infra-statistics/interfaces/interface/latest/generic-counters
 !
 subscription SUB1
  sensor-group-id SGROUP sample-interval 1000
  destination-id DGROUP
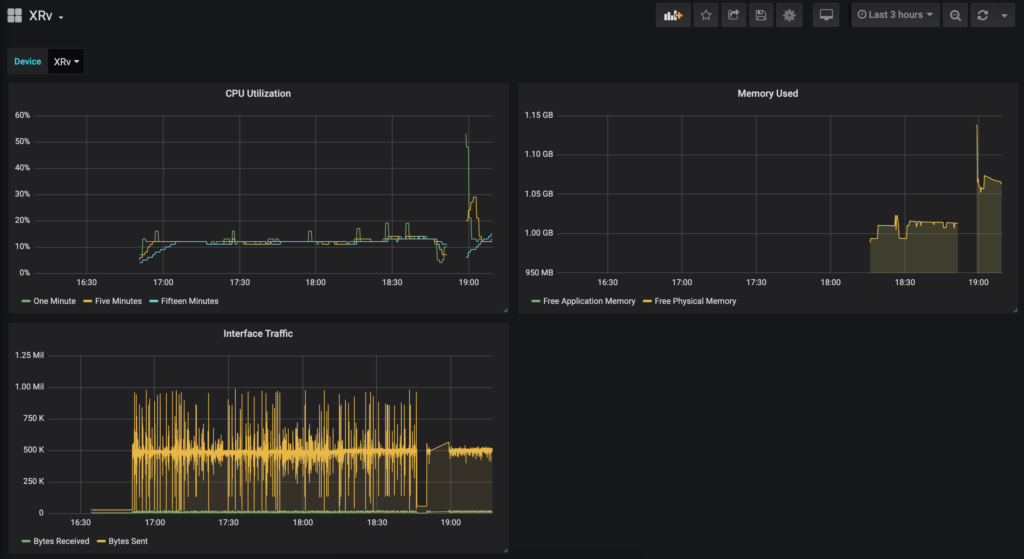
At this point, data should be hitting Influx ready to be graphed. We can verify this with the command show telemetry model-driven subscription.
RP/0/RP0/CPU0:XRv#show telemetry model-driven subscription
Wed Jan  8 19:29:25.027 UTC
Subscription:  SUB1            State: ACTIVE
-------------
  Sensor groups:
  Id                               Interval(ms)        State
  SGROUP                          1000                Partial

  Destination Groups:
  Id                 Encoding            Transport   State   Port    Vrf     IP
  DGROUP            self-describing-gpb grpc        Active  57000           10.0.2.1
    No TLS
Juniper vMX
Telemetry support varies among different devices in the Juniper range, however a firmware version beyond 18.2R1 should contain support across the board. I am running Junos: 18.2R1.9.
Telemetry on the Juniper MX is supported in two ways. The first method involves configuring each metric on each device, and setting the target. This then sends the stream in a UDP session, encapsulated in Google protocol buffers structured messages. At the time of writing, there appeared to be no good option to take this data, and insert it into influx. The two options I found where an old patch for telegraf which does not appear to have been updated for quite some time, or a plugin for fluentd which also seems abandoned and only supports a limited number of metrics.
The second option, and the one I have chosen uses an alternative method. The collector registers each metric it wishes to collect along with the frequency with the device using gRPC. These metrics are then sent to the collector until the collector asks it to stop, or goes away. This requires minimal config on the router side, and is supported by default in Telegraf using a plugin.
Installing Juniper packages
To enable the gRPC telemetry features on a firmware version below 18.3R1, two packages need to be installed on the router. The first is the Network Agent package, which is available from the software download page of the firmware you are running, and the second is the OpenConfig package, which is available as a separate product on Junipers download page. These can be installed using the same commands to upgrade the Juniper firmware.
request system software add /var/home/dave/network-agent-x86-32-18.2R1.9-C1.tgz
request system software add /var/home/dave/junos-openconfig-x86-32-0.0.0.10-1.tgz
You can then verify that the packages are installed by issuing show version | match "Openconfig|na\ telemetry".
root@vMX> show version | match "Openconfig|na\ telemetry"
JUNOS na telemetry [18.2R1.9-C1]
JUNOS Openconfig [0.0.0.10-1]
Device Configuration
The vMX image I am using only supports using SSL encrypted sessions for access to the gRPC interface. As such, we need to provide each router with a certificate. For lab purposes, a self signed certificate can be generated on a linux machine using the following command.
openssl req -x509 -sha256 -nodes -newkey rsa:2048 -keyout cert.pem -out cert.pem
This certificate file can then be uploaded onto the router, and imported with the following configuration statement.
set security certificates local jti-cert load-key-file cert.pem
Next we can apply the configuration to enable the service, using the previously defined certificate. In this example access to the gRPC interface is limited to a single host.
set system services extension-service request-response grpc ssl port 32767
set system services extension-service request-response grpc ssl local-certificate jti-cert
set system services extension-service notification allow-clients address 10.0.2.1/32

system {
    services {
        extension-service {
            request-response {
                grpc {
                    ssl {
                        port 32767;
                        local-certificate jti-cert;
                    }
                }
            }
            notification {
                allow-clients {
                    address 10.0.2.1/32;
                }
            }
        }
    }
}
Telegraf Configuration
Finally we can update the Telegraf configuration to instruct it to connect to our routers and subscribe to the metrics we are interested in. Append the following configuration to the bottom of /etc/telegraf/telegraf.conf, then restart the service with sudo systemctl restart telegraf.
[[inputs.jti_openconfig_telemetry]]
   ## List of device addresses to collect telemetry from
   servers = ["192.168.0.4:32767"]

   ## Authentication details. Username and password are must if device expects
   ## authentication. Client ID must be unique when connecting from multiple instances
   ## of telegraf to the same device
   username = "<USERNAME>"
   password = "<PASSWORD>"
   client_id = "telegraf"

   ## Frequency to get data
   sample_frequency = "1000ms"

   ## Sensors to subscribe for
   ## A identifier for each sensor can be provided in path by separating with space
   ## Else sensor path will be used as identifier
   ## When identifier is used, we can provide a list of space separated sensors.
   ## A single subscription will be created with all these sensors and data will
   ## be saved to measurement with this identifier name
   sensors = [
        "/interfaces/",
        "10000ms /junos/system/linecard/cpu/memory",
        "2000ms  /components"
   ]

   ## Optional TLS Config
   enable_tls = true
   # tls_ca = "/etc/telegraf/ca.pem"
   # tls_cert = "/etc/telegraf/cert.pem"
   # tls_key = "/etc/telegraf/key.pem"
   ## Use TLS but skip chain & host verification
   insecure_skip_verify = true

   ## Delay between retry attempts of failed RPC calls or streams. Defaults to 1000ms.
   ## Failed streams/calls will not be retried if 0 is provided
   retry_delay = "1000ms"

   ## To treat all string values as tags, set this to true
   str_as_tags = false
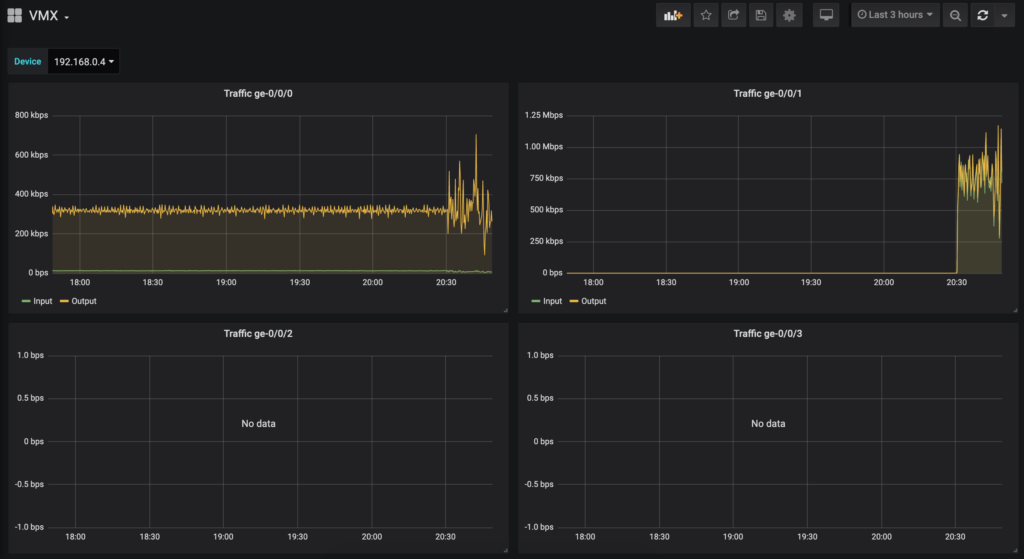
At this point, metrics should be available to create graphs in grafana.
Conclusion
Streaming telemetry appears to be an excellent step forward in metric gathering, and network health status of the network. Open source tools for collecting and viewing this data appear a little immature at this point. This along with the obvious disparity on how different vendors export the metrics make getting this up and running a bit of a steep learning curve. Hopefully in the future vendors will converge on a common approach.
It’s worth noting that IOS XE and IOS XR claim to support the subscription model, similar to Juniper’s, however I have not done any research into how this might work.
Appendix
Useful IOS XE XPaths
CPU:
- /process-cpu-ios-xe-oper:cpu-usage/cpu-utilization/five-seconds
- /process-cpu-ios-xe-oper:cpu-usage/cpu-utilization/one-minute
- /process-cpu-ios-xe-oper:cpu-usage/cpu-utilization/five-minutes
Memory:
- /memory-ios-xe-oper:memory-statistics/memory-statistic/used-memory
- /memory-ios-xe-oper:memory-statistics/memory-statistic/free-memory
Interfaces:
- /interfaces-ios-xe-oper:interfaces/interface/statistics
Useful IOS XR XPaths
CPU:
- sensor-path Cisco-IOS-XR-wdsysmon-fd-oper:system-monitoring/cpu-utilization
Memory:
- sensor-path Cisco-IOS-XR-nto-misc-oper:memory-summary/nodes/node/summary
Interfaces:
- sensor-path Cisco-IOS-XR-infra-statsd-oper:infra-statistics/interfaces/interface/latest/generic-counters
Useful Juniper XPaths
Interfaces:
- /interfaces/
Update 10/07/20
Cisco TAC pointed me to this excellent blog post for finding telemetry sensors on IOS XR. http://www.zhaocs.info/how-to-get-telemetry-sensor-path-for-show-cmd-on-ios-xr.html
Fantastic blog entry!! I’m about to do some CSR1000v testing and getting telemetry into Grafana will make my life MUCH easier.
Many thanks.
Great post! Thanks 🙂 I am using the same SW version for Jupiter vMX, but I have issues finding mentioned packages. Would you be kind to share them with me?
The network agent can be found here:
https://webdownload.juniper.net/swdl/dl/secure/site/1/record/77109.html?pf=MX960
The OpenConfig package can be found here:
https://support.juniper.net/support/downloads/?p=openconfig#sw
Hi,
Good work!
Did you try to configure the dial-in option with Cisco IOS-XR ? Do you know what to configure on the inputs plugin on telegraf.conf file ?
Thanks in advance.
Hi ,Thank you for this tutorial, can you please say how I can see the metrics units on the graphs in Grafana? I am steaming telemetry now but on y axis all i see is just numbers without any units